Bayes' theorem
Categories: statistics probability
Bayes' theorem allows us to calculate probabilities based on relevant prior knowledge. In this article, we will start by looking at how prior knowledge can be applied to probabilities, and derive Bayes' theorem from that.
A probability experiment
Imagine you have a bag containing 100 plastic tokens. Some are square, some are circular. Some are red, some are blue. To be precise:
- 80% of the tokens are squares, the rest are circles.
- Of the square tokens, 75% are red and 25% are blue.
- Of the circle tokens, 10% are red and 90% are blue.
Now suppose someone takes a token from the bag, without you seeing it. They tell you it is blue, and ask you to guess the shape. Given that 90% of the circles are blue, many people might well guess that the shape is almost certainly a circle. In this article, we will see why that logic is flawed.
Here is a diagram of the collection of tokens. You might already be able to see where the logic above is incorrect:

Representing the shape probabilities
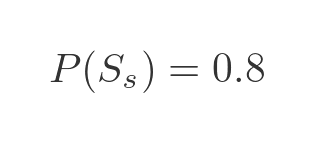
If we draw a random token from the bag, we know from the first statement that the probability that its shape is square, P(Ss), is 80% (or 0.8 as a fraction). We write this as:
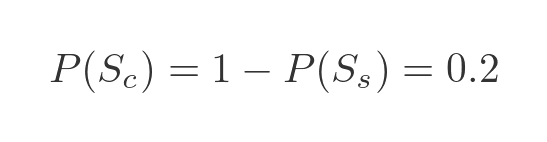
Since there are only 2 possible shapes, if a shape is not square it must be circular. So the probability of it being circular, P(Sc), plus the probability of it being square must be 1:
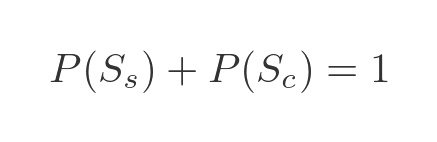
This tells us that the probability of it being circular is 0.2
Representing the colour probabilities
In the original description, we were told that of the square tokens, 75% are red and the rest are blue. In probability terminology, we say that the probability that the token is red, given that the token is square, is 0.75. This is written as:
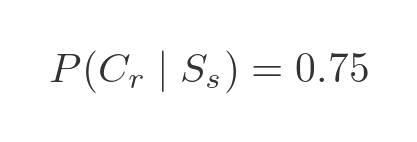
Here, Cr means that the colour of the token is red. The vertical bar indicates that this is the probability of the first term being true given that the second term is known to be true.
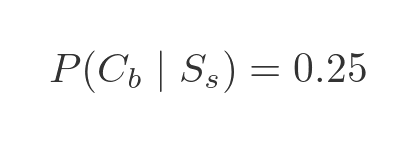
Since tokens are either red or blue, the probability of a square token being blue must be 1 - 0.25:
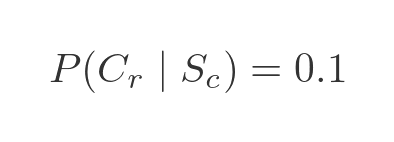
We were also told that the probability that the token is red, given that the token is circular, is 0.1
And by the same logic as before, the probability that the token is blue, given that the token is circular, is:
Probability of a particular shape and colour
We now have enough information to calculate the probability that a randomly selected token will be a red square. We write this as:
This notation indicates the probability of the first condition being true and the second condition being true. The 2 conditions are dependent - when we choose a token, its size and colour are both determined. The standard formula for two dependent conditions is:
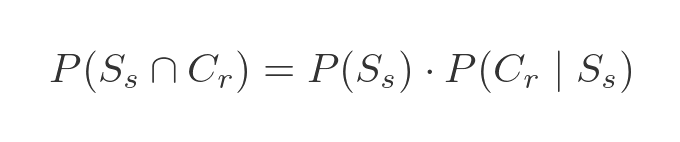
We can understand this intuitively. For the token to be a red square, 2 things must be true:
- The token must be a square, which has a probability P(Ss).
- It must also be red. Since we already know it is square, we must use the probability that the token is red given that it is a square.
The probability of both these things being true is equal to the product of the two individual probabilities, which gives us the expression above.
If we plug our known probabilities into this equation we get:
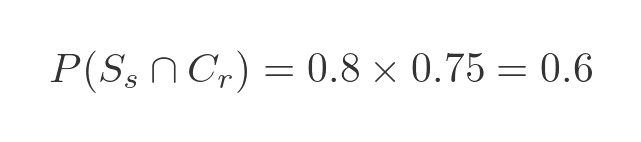
Also, if we look at the diagram of all the 100 tokens we see that there are 80 squares and 60 of them are red (again because 80% are square and 75% of the square tokens are red).
We can calculate the probabilities of blue squares, red circles, and blue circles in a similar way:
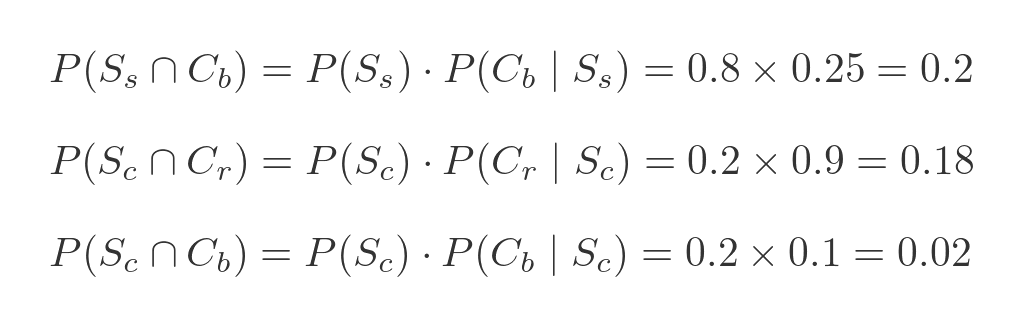
Again these values correspond with the actual number of blue squares (20), red circles (2) and blue circles (18) in the diagram showing the 100 tokens. And of course, the 4 probabilities add up to 1, and you would expect because every token must be one of those 4 types.
Probability tree
A useful way to represent these probabilities is as a tree:
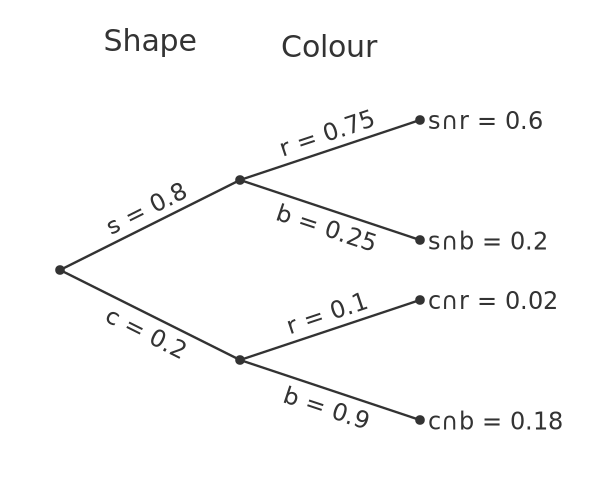
Starting from the left, the first two branches represent the split between the square and circular tokens. The branches are labelled with the probability of a token having that shape.
Each of these branches splits again. The second split represents the different colours for the selected shape. For example the top branch labelled r = 0.75 represents square shapes that are red. The value 0.75, of course, is the probability that a token will be red given that it is square, ie:
The probability of reaching the end of a branch is calculated by multiplying the sections in the path to reach that point. Again using the top branch, the endpoint represents red squares and the overall probability of choosing a red square is 0.8 times 0.75, which is 0.6.
Since the 4 endpoints represent every possible combination of shape and colour, it should be no surprise that adding the 4 end values gives 1.
Probability of a red token
We have complete information about all the probabilities of our set of tokens. We can calculate the probability that a token is square, or the probability that it is a blue circle.
What if we don't care about the shape, we just want to know the probability that the token is red?
We could just count the number of red tokens in the diagram. But counting doesn't always work. For example, what if we were analysing the chances of outside temperature being less the 10 degrees vs the chances of it raining? We can't use counting because these are the probabilities of things that haven't happened yet. We need to calculate combined probabilities.
Instead, we can use the tree to do this. Red items exist on two different paths:
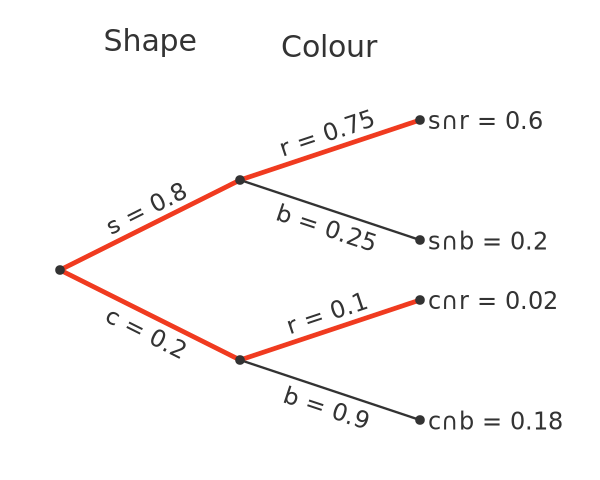
The top path leads to red squares, with a probability of 0.6. The lower path leads to red circles, with a probability of 0.02. So the total probability of a red token is 0.62 (and if you do try counting the red tokens in the original diagram, you will indeed find that 62 of the 100 tokens are red).
Back to the original question
The original question was - suppose someone takes a token from the bag, without you seeing it. They tell you it is blue. What is the most likely shape?
We are trying to find the probability that the shape is square (or round) given that it is blue. We don't have this information directly, because initial description only tells us the probability of a certain colour given the shape. It doesn't tell us the probability of a certain shape given the colour.
But we can work it out from the tree. Here is the tree indicating the paths that lead to a blue token:
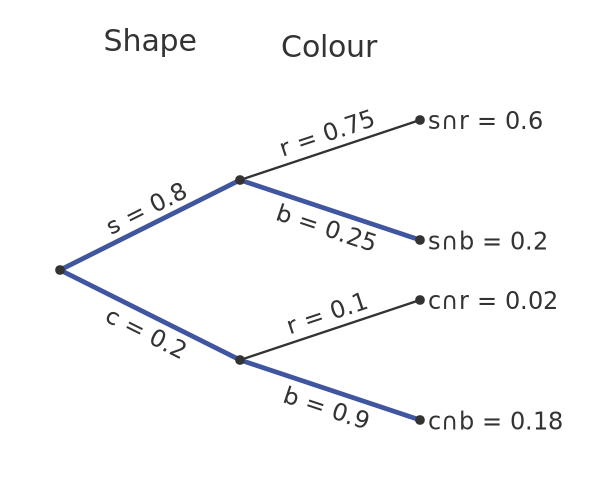
The probability of getting a blue circle is 0.18, and the probability of getting a blue square is 0.2, so the probability of getting a blue token of either type is 0.38.
To find the probability of getting a blue circle given that we already know the token is blue, we need to divide the blue circle probability by the overall blue probability. So it is 0.18 / 0.38. This evaluates to approximately 0.47.
To understand why we divide those numbers, we need to consider what it really means when we are told the token is blue. The fact that the token is blue is extra information we didn't have before. This extra information reduces the space of possible outcomes:

When we know the token is blue, we can eliminate every outcome where the token is red. These have been greyed out in the chart above. We only need to consider the 38 blue tokens.
The token was chosen at random, so each of the 38 tokes is equally likely to be chosen. And since only 18 of those are circular, the probability of the chosen token being circular is 18/38 or, again, about 0.47.
However you look at it, any naive intuition that a blue token is most likely to be circular is incorrect. Even though 90% of circular tokens are blue, it is still the case that slightly more than half the blue tokens are square, so it is slightly more likely that the chosen token will be square.
Bayes' theorem
Using symbols instead of numbers, we can derive a formula for the above result, which is called Bayes' theorem. The probability of the token being blue is, by definition:
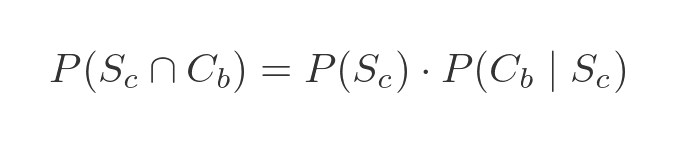
The probability of a token being blue and being a circle, as we saw earlier, is:
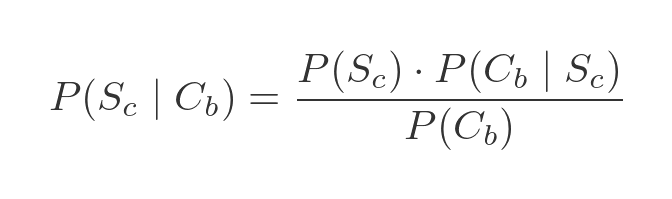
We know from the previous section that the probability of the token being a circle, given that it is blue, is equal to the probability that the token is blue and a circle divided by the probability that the token is blue. Using the values above gives:
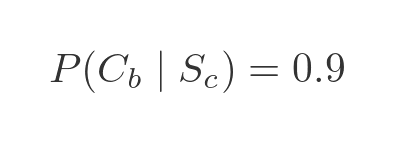
This is the simplest expression of Bayes' theorem. However, we don't directly know the probability of P(Cb). This can be calculated as an extra step from:
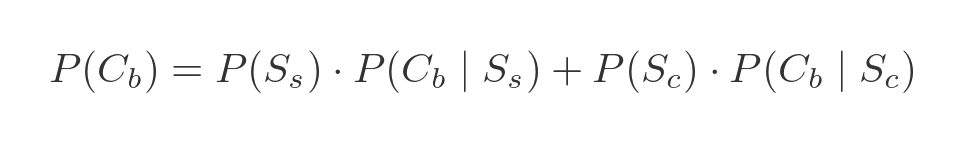
This calculation corresponds exactly to the blue tree calculation above, and in the example case it evaluates to 0.38.
What Bayes' theorem does
Bayes' theorem allows us to take a conditional probability we know (the probability of a colour given the shape) and convert it into a conditional probability we don't know (the probability of a shape given the colour).
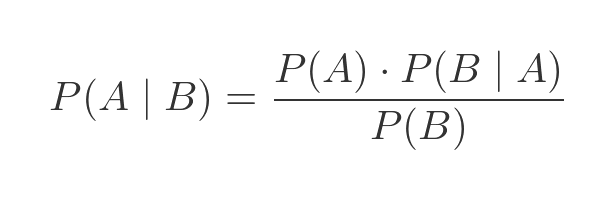
The general form of the equation is:
Derivation of Bayes' theorem
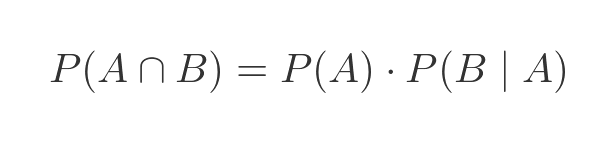
Previously we saw this equation for the probability of two dependent values:
Substituting A and B for the two variables:
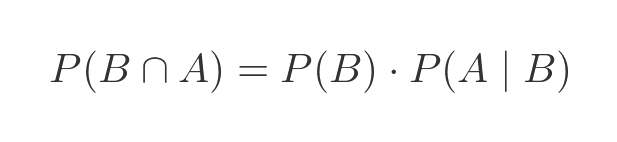
The same formula is true if we interchange A and B:
And of course the probability of A and B is the same as the probability of B and A:
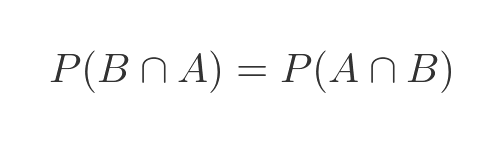
So the 2 right-hand sides of the previous equations are also equal:
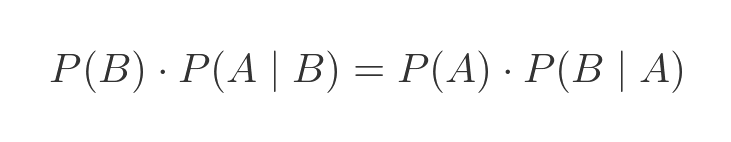
Dividing both sides by P(B) (assuming it is not 0) gives the Bayes equation:
Summary
Bayes' theorem provides a method of calculating probabilities based on additional knowledge about the conditions. We have seen how to do that by simply counting the number of tokens of each shape and colour. Bayes' theorem simply expresses this process as an equation.
Join the GraphicMaths Newsletter
Sign up using this form to receive an email when new content is added to the graphpicmaths or pythoninformer websites:
Popular tags
adder adjacency matrix alu and gate angle answers area argand diagram binary maths cardioid cartesian equation chain rule chord circle cofactor combinations complex modulus complex numbers complex polygon complex power complex root cosh cosine cosine rule countable cpu cube decagon demorgans law derivative determinant diagonal differential equation directrix dodecagon e eigenvalue eigenvector einstein ellipse equilateral triangle erf function euclid euler eulers formula eulers identity exercises exponent exponential exterior angle first principles flip-flop focus gabriels horn galileo gamma function gaussian distribution gradient graph hendecagon heptagon heron hexagon hilbert horizontal hyperbola hyperbolic function hyperbolic functions infinity integration integration by parts integration by substitution interior angle inverse function inverse hyperbolic function inverse matrix irrational irrational number irregular polygon isomorphic graph isosceles trapezium isosceles triangle kite koch curve l system lhopitals rule limit line integral locus logarithm maclaurin series major axis matrix matrix algebra mean minor axis n choose r nand gate net newton raphson method nonagon nor gate normal normal distribution not gate octagon or gate parabola parallelogram parametric equation pentagon perimeter permutation matrix permutations pi pi function polar coordinates polynomial power probability probability distribution product rule proof pythagoras proof pythagorean triple quadrilateral questions quotient rule radians radius rectangle regular polygon rhombus root sech segment set set-reset flip-flop simpsons rule sine sine rule sinh slope sloping lines solving equations solving triangles special relativity speed of light square square root squeeze theorem standard curves standard deviation star polygon statistics straight line graphs surface of revolution symmetry tangent tanh transformation transformations translation trapezium triangle turtle graphics uncountable variance vertical volume volume of revolution xnor gate xor gate